Limits of Traditional Value Measurements: May 2021 Newsletter Excerpt

When he was younger, he approached this very objectively with things like the price-to-earnings ratio or “P/E Ratio.” Traditionally, a normal P/E Ratio is in the range of 13-15.
The past 20 years, Buffett has drifted to a more subjective approach that buys excellent brands and companies with a competitive moat. Part of the reason for his shift is that technology has made it very easy to determine an objective value of a company. This means it’s unlikely you’re going to be early to a value only opportunity. Also, more importantly, it’s not rare that an excellent stock or the stock market in general can be “overvalued” through a long price increase.
Case in Point: Amazon
We all know that Amazon is one of the great business successes of our age. Many of you remember when Amazon only sold books. It’s stunning to see what it has become.
During the Dot Com Boom of the late 90s, many companies were harangued for having such high valuations without showing a profit. Amazon in particular took seven years to finally turn a profit in 2001.
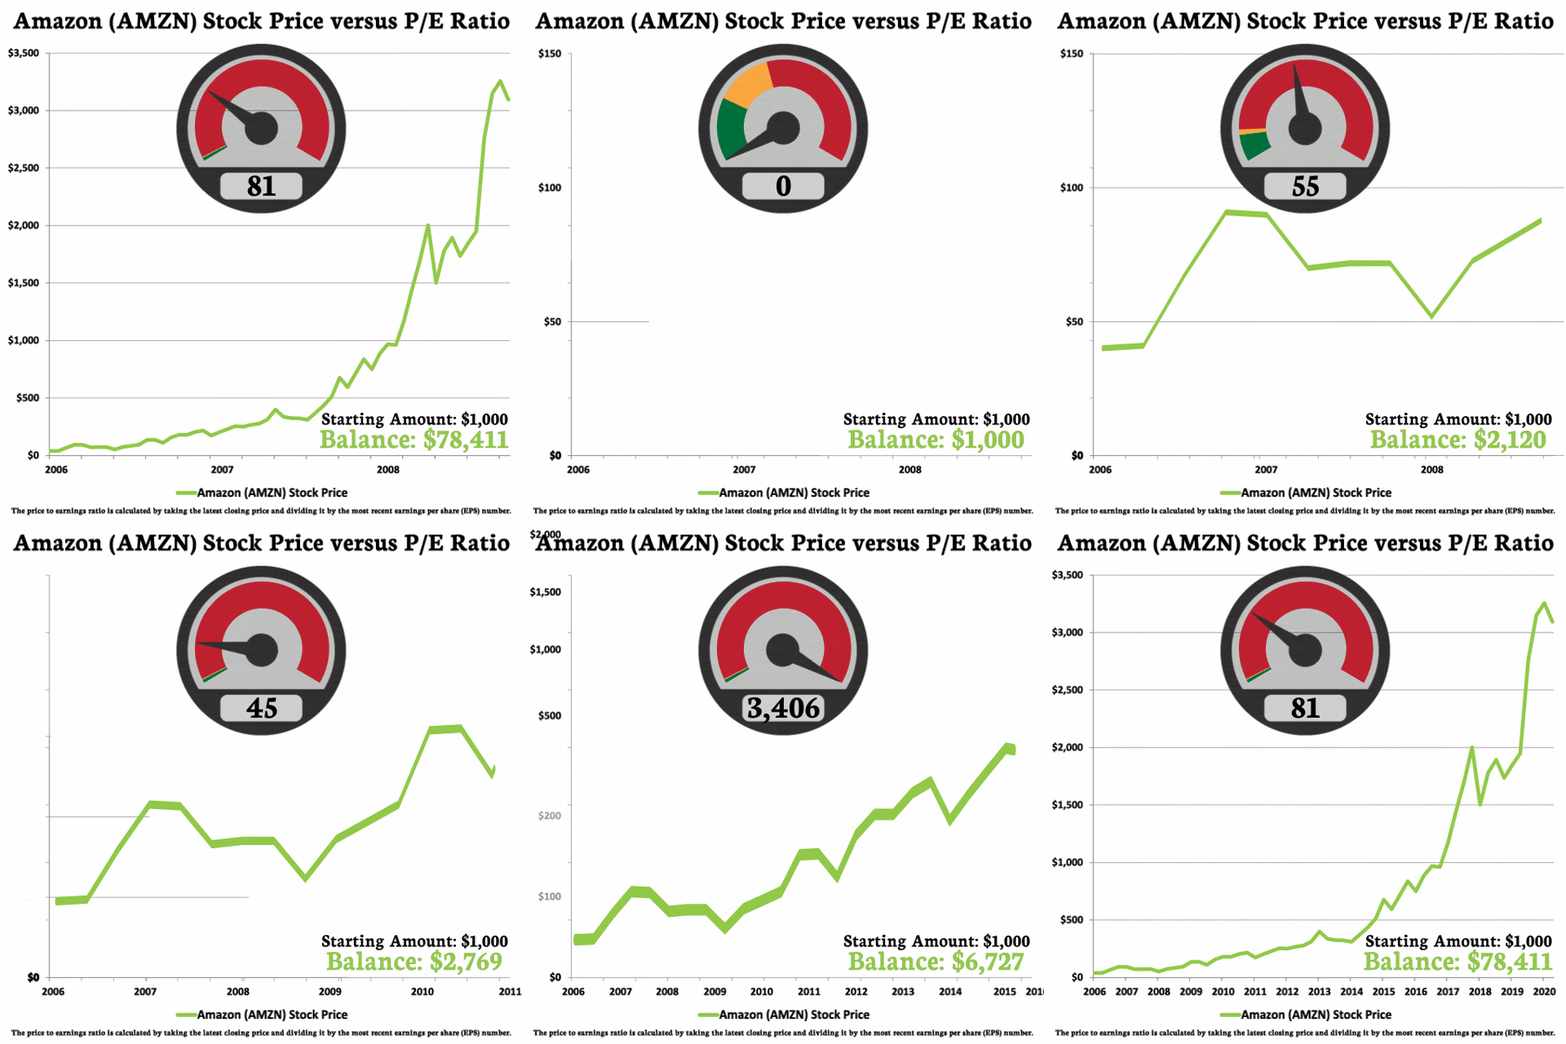
Let’s go back in time and imagine we were keeping an eye on Amazon for a wise time to invest. By 2006, it was clear that Amazon’s business was working. However, knowing that a “normal” P/E Ratio is around 13-15, and that Amazon’s P/E ratio in 2006 was sky high at 88, it probably seemed wise to wait for a better buying opportunity.
Here’s the fact: by traditional means of value measurement, Amazon has always been overvalued. Starting in 2006, you would have never received an obvious buy signal.
Let’s look at this visually. We could represent the P/E Ratio with a gauge where normal is represented in yellow. If a stock has a ratio less than 13, then it is considered undervalued – this is the green area on the gauge. If it is over 15, then it is considered overvalued – this is the red area.
When we look at the history of Amazon’s stock price and P/E Ratio, the stock has always been overvalued in the range of extremely overvalued to jaw-droppingly overvalued. The lowest it’s P/E Ratio has been in the past 15 years was 34 and it has been as high as 3,633, and technically “infinite” when it didn’t show a profit. Yet, during all of this time of being overvalued, those who ignored this in 2006 would have enjoyed about an 80x of their initial investment.
We can see this 15 year history of Amazon’s stock price along with the P/E Ratio (the number inside the gauge):

|
The lesson from Amazon is not necessarily to ignore the P/E Ratio or any other value measurement of a stock, but that there’s always much more to the picture. Currently, based on traditional forms of measurement, the stock market is overvalued, but there’s more to the picture.
|

