Inflation and The Price of Candy (April Newsletter Excerpt)

For those who grew up in the United States, most of our experience with inflation has been relatively tame. The exception of this was the 1970s when it was above 10% for a few of those years – still mild by global standards. You may shake your head as you remember the price of a candy bar when you were a kid, but not at what the price was last year.
Recently this has changed. We are all noticing prices going up. This is beyond what we see on gas station signs. You may have noticed that milk suddenly costs about a dollar more per gallon.
Inflated Prices = Inflated Value and Earnings
It is never comfortable to see rising prices. If your assets are positioned in the wrong place, inflation can be deeply destructive. However, if in the right place, it can be a financial tailwind.
Personal Inflation Rate
|
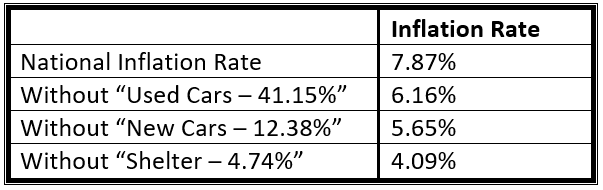
Recently a client joked with us that we had to keep making her money because prices were going up so much. This past year, prices went up by 7.87% – the most in 40 years. This is considerably higher than the usual 2-3% each year. It’s important to keep in mind what is built into this number and to get a sense of what your inflation number is – or your “Personal Inflation Rate.”
We are all aware of rising car prices this past year. This is contrary to the adage that you lose thousands of dollars the second you drive it off the lot. Today, some cars are selling for more than their new price three years ago. In the past 12 months used car prices went up by 41.15%. But if you didn’t buy a used car, then you shouldn’t consider this as part of your Personal Inflation Rate. If we remove “Used Car Prices” from the national inflation rate, it drops to 6.16%. We could do the same with “New Car Prices” which went up by 12.38%. If you exclude this then the inflation rate drops to 5.65%. The most interesting one is the cost of “Shelter” which went up 4.74%. This is a very general number which incorporates rents and other items. If you own your home, then does this piece of inflation hurt you or help you? It helps you in two ways:
If you exclude “Shelter” prices, then your Personal Inflation Rate drops to 4.09%. And now we are with an inflation rate that’s back down to earth. Here is what this looks like: |
|
This isn’t to say it’s all peaches and cream. Eventually you may buy a car and be met with higher prices, but for now higher inflation may not be affecting an individual as much as the average inflation rate suggests.
|
The Right Side of Rising Prices
|
It’s important to consider all the moving parts in an economy. When you own a home, you are on the sunny side of rising prices. How else can we accomplish this?
When prices go up, let’s think about what this means. Who is raising the prices and where does that “extra money” go? In most cases, there is a company behind those rising prices. We can imagine the ripple effect of rising prices:
Therefore, the cost of goods goes up for the final consumer. However, what happens along the way is that earnings go up for the companies in this chain of consumption. All things equal, if a company’s earnings go up, the stock price should go up proportionally. If you own stocks, it can be a protection against inflation because rising inflation normally means rising earnings. The act of you spending more money means that someone or some business is getting more money (or “revenue”). In an inflationary environment, a business will naturally look to earn more revenue to offset rising costs. Granted, some companies can do this better than others. If consumers want or need a product, they will pay the higher price. To get an “apples-for-apples” look at historical inflation. In 1950, a 1 oz. Hershey’s bar was $0.10. Today, a king size Hershey bar is 2.6 oz. While a king size didn’t exist back then, if we start with a $0.26 price in 1950 and only adjust it for inflation, we can see what the price should be today. By the time we get to 2022, we would expect the price to be just under $3.00. This is close to what you’d pay in a gas station these days. What this means is that candy is about the same “real price” as when you were a kid, it just doesn’t feel that way. |
|
For Hershey’s, it may look like they are making more money per ounce of chocolate. These higher earnings may justify a higher stock price, but some of that revenue growth is simply from inflation. It is because of this that owning stocks can be an excellent inflation hedge over the long term. You are putting yourself of the sunny side of raising prices. In a sense, as an owner of companies, you are the one raising prices.
|